Basisstatistiken
| Institutionelle Aktien (Long) | 62.502.184 - 140,47% (ex 13D/G) - change of -0,11MM shares -0,25% MRQ |
| Institutioneller Wert (Long) | $ 1.495.664 USD ($1000) |
Institutioneller Eigentümerschaft und Aktionäre
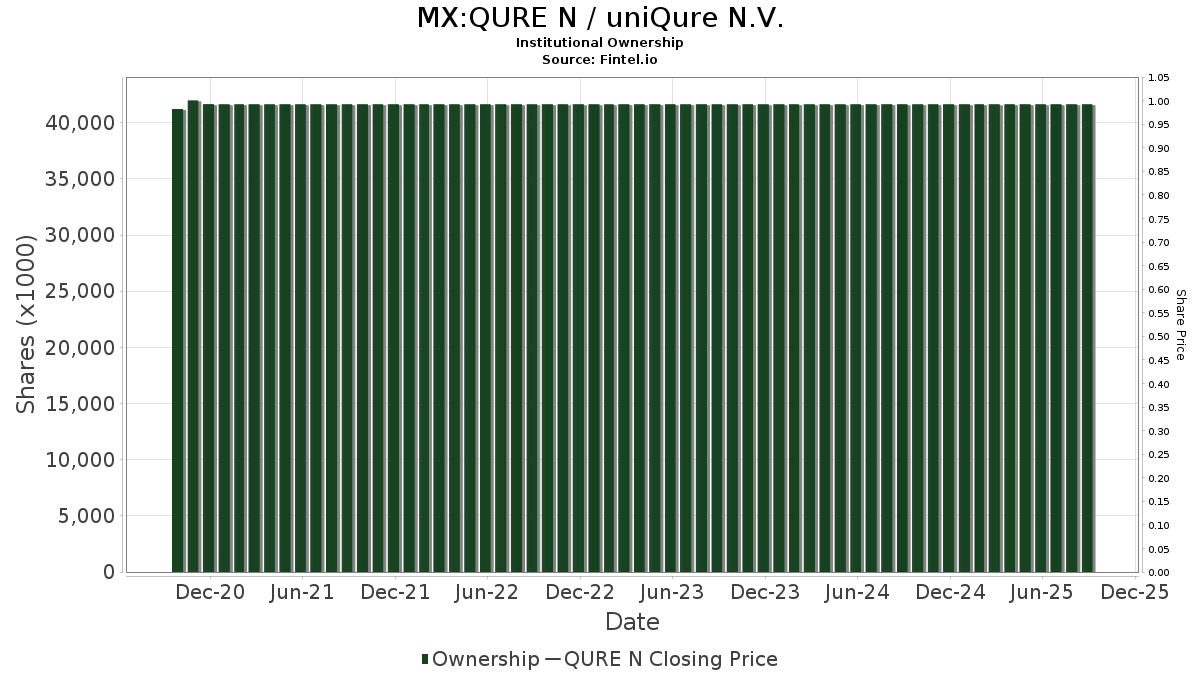
uniQure N.V. (MX:QURE N) hat 251 institutionelle Eigentümer und Aktionäre, die 13D/G oder 13F Formulare bei der Securities Exchange Commission (SEC) eingereicht haben. Diese Institutionen halten insgesamt 62,505,625 Aktien. Die größten Aktionäre sind Fmr Llc, Avoro Capital Advisors LLC, Rtw Investments, Lp, Standard Life Aberdeen plc, State Street Corp, Jpmorgan Chase & Co, Susquehanna International Group, Llp, BlackRock, Inc., Two Sigma Investments, Lp, and MPM Oncology Impact Management LP .
uniQure N.V. (BMV:QURE N) Die institutionelle Eigentümerstruktur zeigt die aktuellen Positionen von Institutionen und Fonds im Unternehmen sowie die jüngsten Veränderungen der Positionsgröße. Zu den Großaktionären können Einzelanleger, Investmentfonds, Hedgefonds oder Institutionen gehören. Der Schedule 13D zeigt an, dass der Investor mehr als 5% des Unternehmens hält (oder gehalten hat) und beabsichtigt (oder beabsichtigt hat), aktiv eine Änderung der Geschäftsstrategie zu verfolgen. Schedule 13G zeigt eine passive Investition von über 5% an.
Fondsstimmung-Score
Der Fondsstimmung-Score (auch bekannt als Eigentümer-Akkumulations-Score) ermittelt die Aktien, die am meisten von Fonds gekauft werden. Er ist das Ergebnis eines ausgeklügelten quantitativen Multifaktormodells, das die Unternehmen mit den höchsten institutionellen Käufen identifiziert. Das Scoring-Modell verwendet eine Kombination aus der Gesamtzunahme der offengelegten Eigentümer, den Änderungen der Portfolioallokationen in diesen Eigentümern und anderen Metriken. Die Zahl reicht von 0 bis 100, wobei höhere Zahlen ein höheres Maß an Kapitalakkumulation als bei anderen Unternehmen anzeigen und 50 den Durchschnitt darstellt.
Aktualisierungshäufigkeit: Täglich
Siehe Ownership Explorer, der eine Liste der am höchsten bewerteten Unternehmen enthält.
AI+ Ask Fintel’s AI assistant about uniQure N.V..
Select a question to share a public post with an AI-crafted answer.
Thinking of good questions…
13F und NPORT Einreichungen
Details zu 13F-Einreichungen sind kostenlos. Für Details zu NP-Einreichungen ist eine Premium-Mitgliedschaft erforderlich. Grüne Zeilen zeigen neue Positionen an. Rote Zeilen zeigen geschlossene Positionen an. Klicken Sie auf das Link Symbol, um den gesamten Transaktionsverlauf zu sehen.
Upgrade
um Prämiendaten freizuschalten und nach Excel zu exportieren ![]() .
.
| Datei Datum | Quelle | Anleger | Typ | Durchschnittlicher Preis (Est) |
Aktien | Δ Aktien (%) |
Gemeldeter Wert ($1000) |
Δ Wert (%) |
Port Alloc (%) |
|
|---|---|---|---|---|---|---|---|---|---|---|
| 2026-02-17 | 13F | Resolute Capital Asset Partners LLC | 0 | -100,00 | 0 | -100,00 | ||||
| 2025-11-14 | 13F | Point72 Europe (London) LLP | 1.552 | 91 | ||||||
| 2025-09-24 | NP | SWTSX - Schwab Total Stock Market Index Fund This fund is a listed as child fund of Charles Schwab Investment Management Inc and if that institution has disclosed ownership in this security, then these positions will not be double counted when calculating total shares and total value | 23.627 | 0,00 | 329 | -5,75 | ||||
| 2026-02-10 | 13F | Bank of New York Mellon Corp | 43.309 | 94,99 | 1.036 | -20,06 | ||||
| 2026-02-17 | 13F | J. Goldman & Co LP | Call | 20.300 | -69,93 | 486 | -87,69 | |||
| 2026-01-09 | 13F | SG Americas Securities, LLC | 64.326 | 508,05 | 2 | |||||
| 2026-02-12 | 13F | Aristides Capital LLC | 0 | -100,00 | 0 | |||||
| 2026-01-13 | 13F | CoreCap Advisors, LLC | 19 | 0 | ||||||
| 2026-02-09 | 13F | Sectoral Asset Management Inc | 30.585 | -0,50 | 732 | -59,25 | ||||
| 2026-02-12 | 13F | Hrt Financial Lp | 156.000 | 4 | ||||||
| 2026-02-17 | 13F | Massar Capital Management, LP | 40.529 | 102,64 | 970 | -16,97 | ||||
| 2026-02-13 | 13F | Quinn Opportunity Partners LLC | 10.000 | -90,71 | 239 | -96,19 | ||||
| 2026-01-29 | 13F | Vanguard Group Inc | 1.051.379 | -6,55 | 25.160 | -61,69 | ||||
| 2026-02-11 | 13F | Jpmorgan Chase & Co | 2.934.626 | 155,33 | 70.226 | 4,68 | ||||
| 2026-02-17 | 13F | Atom Investors LP | 78.209 | 65,38 | 1.872 | -32,21 | ||||
| 2026-02-17 | 13F | J. Goldman & Co LP | 20.250 | 485 | ||||||
| 2026-02-17 | 13F | Advisor Group Holdings, Inc. | 587 | 428,83 | 14 | 133,33 | ||||
| 2026-02-17 | 13F | Tudor Investment Corp Et Al | Call | 23.800 | 29,35 | 570 | -47,02 | |||
| 2026-02-17 | 13F | Tudor Investment Corp Et Al | Put | 102.100 | 470,39 | 2.443 | 134,00 | |||
| 2026-02-17 | 13F | Tudor Investment Corp Et Al | 74.036 | 157,81 | 1.772 | 5,67 | ||||
| 2026-02-17 | 13F/A | Militia Capital Partners, LP | 8.500 | -75,71 | 203 | -90,06 | ||||
| 2026-01-23 | 13F | Assetmark, Inc | 18.613 | 445 | ||||||
| 2026-03-09 | 13F | Flax Pond Capital, Llc | 146.498 | 3.506 | ||||||
| 2026-01-27 | 13F | First Horizon Corp | 3 | -99,22 | 0 | -100,00 | ||||
| 2025-09-26 | NP | ISCG - iShares Morningstar Small-Cap Growth ETF | 6.145 | 86 | ||||||
| 2026-02-13 | 13F | Peak6 Llc | Put | 7.000 | 168 | |||||
| 2026-01-30 | 13F | Torren Management, LLC | 1.169 | 28 | ||||||
| 2026-02-03 | 13F | SBI Securities Co., Ltd. | 280 | -75,40 | 7 | -90,91 | ||||
| 2026-02-13 | 13F | Peak6 Llc | Call | 179.500 | 1.517,12 | 4.295 | 563,83 | |||
| 2025-11-14 | 13F | 683 Capital Management, LLC | Put | 0 | -100,00 | 0 | -100,00 | |||
| 2026-02-17 | 13F | Woodline Partners LP | 0 | -100,00 | 0 | |||||
| 2026-02-06 | 13F | Handelsbanken Fonder AB | 14.900 | 0 | ||||||
| 2026-02-17 | 13F | Northern Trust Corp | 168.820 | 10,75 | 4.040 | -54,60 | ||||
| 2026-02-13 | 13F | Y-Intercept (Hong Kong) Ltd | 45.778 | 101,63 | 1.095 | -17,36 | ||||
| 2025-11-13 | 13F | Pale Fire Capital SE | 0 | -100,00 | 0 | -100,00 | ||||
| 2026-01-14 | 13F | ORG Partners LLC | 114 | 3 | ||||||
| 2026-02-17 | 13F | Clearline Capital LP | 83.681 | 2.002 | ||||||
| 2025-11-14 | 13F | Avidity Partners Management LP | 0 | -100,00 | 0 | |||||
| 2026-02-13 | 13F | Lord, Abbett & Co. Llc | 0 | -100,00 | 0 | |||||
| 2026-02-17 | 13F | Jones Financial Companies Lllp | 418 | -31,36 | 10 | -69,70 | ||||
| 2026-02-17 | 13F | StemPoint Capital LP | 43.485 | -91,67 | 1.041 | -96,59 | ||||
| 2026-02-13 | 13F | Umb Bank N A/mo | 200 | 0,00 | 5 | -63,64 | ||||
| 2026-02-13 | 13F | Macquarie Group Ltd | 0 | -100,00 | 0 | |||||
| 2026-02-17 | 13F | Engineers Gate Manager LP | 43.356 | 1.038 | ||||||
| 2026-01-28 | 13F | Klp Kapitalforvaltning As | 8.400 | 0,00 | 201 | -58,98 | ||||
| 2026-02-17 | 13F | Moore Capital Management, Lp | 75.000 | 1.795 | ||||||
| 2026-02-17 | 13F | Susquehanna International Group, Llp | Put | 498.800 | -43,57 | 11.936 | -76,87 | |||
| 2026-01-28 | 13F | Teacher Retirement System Of Texas | 0 | -100,00 | 0 | |||||
| 2026-02-17 | 13F | Susquehanna International Group, Llp | Call | 2.251.400 | 147,84 | 53.876 | 1,61 | |||
| 2026-02-17 | 13F | Orbimed Advisors Llc | 737.400 | 60,83 | 17.646 | -34,07 | ||||
| 2026-02-17 | 13F | Susquehanna International Group, Llp | 1.218.350 | 440,19 | 29.155 | 121,48 | ||||
| 2026-02-17 | 13F | Longaeva Partners L.P. | 0 | -100,00 | 0 | |||||
| 2026-02-11 | 13F | Group One Trading, L.p. | Put | 110.700 | -76,10 | 2.649 | -90,20 | |||
| 2026-02-13 | 13F | MAI Capital Management | 28 | 154,55 | 1 | |||||
| 2026-02-11 | 13F | Group One Trading, L.p. | Call | 845.800 | 95,33 | 20.240 | -19,92 | |||
| 2026-02-12 | 13F | BlackRock, Inc. | 1.974.988 | 36,57 | 47.261 | -44,01 | ||||
| 2026-02-13 | 13F | Stifel Financial Corp | 45.987 | -21,09 | 1.100 | -67,66 | ||||
| 2026-01-20 | 13F | Signaturefd, Llc | 249 | 0,00 | 6 | -64,29 | ||||
| 2026-02-13 | 13F | Walleye Trading LLC | 7.657 | -83,82 | 183 | -93,37 | ||||
| 2026-02-13 | 13F | JustInvest LLC | 12.356 | -0,67 | 296 | -59,37 | ||||
| 2026-02-13 | 13F | Walleye Trading LLC | Put | 18.200 | 1.416,67 | 436 | 521,43 | |||
| 2026-02-13 | 13F | Walleye Trading LLC | Call | 23.900 | 1,27 | 572 | -58,53 | |||
| 2026-02-13 | 13F | Walleye Capital LLC | 78.996 | -23,24 | 1.890 | -68,53 | ||||
| 2026-02-13 | 13F | Walleye Capital LLC | Call | 33.600 | 18,31 | 804 | -51,48 | |||
| 2025-11-14 | 13F | Susquehanna Fundamental Investments, Llc | 0 | -100,00 | 0 | -100,00 | ||||
| 2026-02-17 | 13F | Bellevue Group AG | 4.763 | 0,00 | 114 | -59,35 | ||||
| 2026-01-30 | 13F | Us Bancorp \de\ | 6.171 | 775,32 | 148 | 258,54 | ||||
| 2026-02-17 | 13F | California State Teachers Retirement System | 35.947 | 14,81 | 860 | -52,93 | ||||
| 2026-02-17 | 13F | Janus Henderson Group Plc | 16.900 | -15,08 | 404 | -65,20 | ||||
| 2026-02-12 | 13F | Ensign Peak Advisors, Inc | 3.650 | 21,67 | 87 | -50,29 | ||||
| 2026-02-03 | 13F | Mitsubishi UFJ Kokusai Asset Management Co., Ltd. | 8.098 | -47,59 | 189 | -79,02 | ||||
| 2026-01-08 | 13F | Grove Bank & Trust | 0 | -100,00 | 0 | -100,00 | ||||
| 2026-02-13 | 13F | Walleye Capital LLC | Put | 29.300 | 1.231,82 | 701 | 447,66 | |||
| 2026-02-11 | 13F | LPL Financial LLC | 21.969 | -52,36 | 526 | -80,49 | ||||
| 2026-02-12 | 13F | Jane Street Group, Llc | Put | 36.500 | -92,78 | 873 | -97,04 | |||
| 2026-02-13 | 13F | DLD Asset Management, LP | Call | 10.000 | -83,44 | 239 | -93,22 | |||
| 2026-02-13 | 13F | Wells Fargo & Company/mn | 70.236 | 547,75 | 1.681 | 165,82 | ||||
| 2026-02-12 | 13F | Jane Street Group, Llc | Call | 354.400 | -44,50 | 8.481 | -77,25 | |||
| 2025-11-14 | 13F | Integral Health Asset Management, LLC | 600.000 | -55,56 | 35.022 | 86,10 | ||||
| 2026-01-14 | 13F | Hennion & Walsh Asset Management, Inc. | 67.739 | 31,24 | 1.621 | -46,22 | ||||
| 2025-11-14 | 13F | Main Management ETF Advisors, LLC | 0 | -100,00 | 0 | |||||
| 2026-02-17 | 13F | Owl Creek Asset Management, L.P. | 0 | -100,00 | 0 | -100,00 | ||||
| 2025-11-14 | 13F | Goldman Sachs Group Inc | Call | 0 | -100,00 | 0 | -100,00 | |||
| 2026-02-11 | 13F | Parallel Advisors, LLC | 848 | 20 | ||||||
| 2026-02-17 | 13F | Apis Capital Advisors, LLC | 0 | -100,00 | 0 | |||||
| 2026-02-17 | 13F | Two Sigma Advisers, Lp | 1.110.400 | 171,16 | 26.572 | 11,17 | ||||
| 2026-02-10 | 13F | Monaco Asset Management SAM | 25.000 | -37,36 | 598 | -74,32 | ||||
| 2026-02-17 | 13F | Ikarian Capital, LLC | Call | 105.400 | -80,32 | 2.522 | -91,93 | |||
| 2026-02-17 | 13F | Ikarian Capital, LLC | 91.060 | 55,37 | 2.179 | -36,31 | ||||
| 2025-11-13 | 13F | UBS Group AG | Call | 0 | -100,00 | 0 | -100,00 | |||
| 2026-02-13 | 13F | Citigroup Inc | 184.765 | 1.496,24 | 4.421 | 554,96 | ||||
| 2026-02-12 | 13F | Ci Investments Inc. | 37.841 | -20,23 | 906 | 45.150,00 | ||||
| 2026-02-13 | 13F | Citigroup Inc | Call | 30.000 | 0,00 | 718 | -59,05 | |||
| 2026-02-13 | 13F | Citigroup Inc | Put | 30.000 | 0,00 | 718 | -59,05 | |||
| 2026-02-13 | 13F | Exome Asset Management LLC | 0 | -100,00 | 0 | |||||
| 2026-02-12 | 13F | Soleus Capital Management, L.P. | 0 | -100,00 | 0 | |||||
| 2026-02-13 | 13F | Schroder Investment Management Group | 55.015 | 1.308 | ||||||
| 2026-02-13 | 13F | Smartleaf Asset Management LLC | 2.000 | 48 | ||||||
| 2026-02-18 | 13F/A | ADAR1 Capital Management, LLC | Call | 30.000 | -85,00 | 718 | -93,86 | |||
| 2026-02-18 | 13F/A | ADAR1 Capital Management, LLC | 235.155 | 76,39 | 5.627 | -27,68 | ||||
| 2026-02-23 | 13F | Virtu Financial LLC | 0 | -100,00 | 0 | -100,00 | ||||
| 2026-02-17 | 13F | Catalio Capital Management, LP | 288.345 | 1,91 | 6.900 | -58,22 | ||||
| 2026-01-28 | 13F | Arizona State Retirement System | 11.141 | 5,96 | 267 | -56,61 | ||||
| 2025-11-14 | 13F | Jane Street Group, Llc | 0 | -100,00 | 0 | -100,00 | ||||
| 2026-02-17 | 13F | Readystate Asset Management Lp | 361.560 | 8.652 | ||||||
| 2026-02-06 | 13F | Profund Advisors Llc | 59.463 | 248,06 | 1.423 | 42,63 | ||||
| 2026-02-10 | 13F/A | Northwestern Mutual Wealth Management Co | 3 | 0 | ||||||
| 2026-02-06 | 13F | Larson Financial Group LLC | 8 | 0,00 | 0 | |||||
| 2026-02-17 | 13F | Polymer Capital Management (US) LLC | 0 | -100,00 | 0 | |||||
| 2026-02-13 | 13F | Velan Capital Investment Management LP | 0 | -100,00 | 0 | |||||
| 2026-01-30 | 13F | Pekin Hardy Strauss, Inc. | 29.300 | 701 | ||||||
| 2026-02-11 | 13F | BIT Capital GmbH | 31.614 | 757 | ||||||
| 2026-02-17 | 13F | Cresset Asset Management, LLC | 0 | -100,00 | 0 | -100,00 | ||||
| 2026-02-17 | 13F | Rtw Investments, Lp | 3.711.462 | -16,12 | 88.815 | -65,61 | ||||
| 2025-09-29 | NP | BBC - Virtus LifeSci Biotech Clinical Trials ETF | 7.610 | -30,27 | 106 | -34,78 | ||||
| 2026-02-11 | 13F | Havemeyer Place LP | 29.655 | 710 | ||||||
| 2026-02-05 | 13F | Qsemble Capital Management, LP | 15.931 | 381 | ||||||
| 2026-02-03 | 13F | Washington Trust Advisors, Inc. | 0 | -100,00 | 0 | |||||
| 2026-02-10 | 13F | Clear Harbor Asset Management, LLC | 16.900 | 141,43 | 404 | -0,98 | ||||
| 2026-02-17 | 13F | Sig Brokerage, Lp | Put | 11.000 | 83,33 | 263 | -24,86 | |||
| 2026-02-13 | 13F | Sofinnova Investments, Inc. | 176.513 | 28,97 | 4.224 | -47,13 | ||||
| 2026-02-17 | 13F | Sig Brokerage, Lp | Call | 31.000 | -39,22 | 742 | -75,10 | |||
| 2026-02-13 | 13F | SRS Capital Advisors, Inc. | 6 | -91,04 | 0 | -100,00 | ||||
| 2026-02-17 | 13F | Logos Global Management LP | 675.000 | 125,00 | 16.153 | -7,76 | ||||
| 2026-02-10 | 13F | Clear Harbor Asset Management, LLC | Put | 1.000 | 24 | |||||
| 2026-02-17 | 13F | Jump Financial, LLC | 306.131 | 7.326 | ||||||
| 2026-02-13 | 13F | Maverick Capital Ltd | 661.820 | 15.837 | ||||||
| 2026-02-09 | 13F | Legal & General Group Plc | 31.964 | -10,27 | 765 | -63,25 | ||||
| 2026-02-05 | 13F | Allworth Financial LP | 174 | 0,00 | 4 | -60,00 | ||||
| 2026-02-13 | 13F | Sei Investments Co | 13.938 | -79,28 | 333 | -91,52 | ||||
| 2026-02-17 | 13F | Ally Bridge Group (NY) LLC | Call | 200.000 | 4.786 | |||||
| 2026-01-29 | 13F | Pictet Asset Management Holding SA | 0 | -100,00 | 0 | -100,00 | ||||
| 2026-02-12 | 13F | Silverarc Capital Management, Llc | 126.047 | -72,30 | 3.016 | -88,64 | ||||
| 2026-02-12 | 13F | Silverarc Capital Management, Llc | Call | 720.800 | 17.249 | |||||
| 2026-02-17 | 13F | Sphera Funds Management Ltd. | 0 | -100,00 | 0 | |||||
| 2026-02-13 | 13F | Centiva Capital, LP | Call | 268.300 | 14,85 | 6.420 | -52,92 | |||
| 2026-01-29 | 13F | IMC-Chicago, LLC | Put | 106.900 | 2.558 | |||||
| 2026-02-12 | 13F | Marex Group plc | 85.993 | -1,00 | 2.058 | -59,42 | ||||
| 2026-02-13 | 13F | Ubs Asset Management Americas Inc | 80.249 | 1.920 | ||||||
| 2026-01-29 | 13F | IMC-Chicago, LLC | Call | 236.400 | 5.657 | |||||
| 2026-02-17 | 13F | Sphera Funds Management Ltd. | Put | 0 | -100,00 | 0 | ||||
| 2026-02-10 | 13F | State of Wyoming | 161 | 4 | ||||||
| 2026-02-13 | 13F | Hudson Bay Capital Management LP | Put | 0 | -100,00 | 0 | -100,00 | |||
| 2026-02-17 | 13F | Lighthouse Investment Partners, LLC | 12.500 | 299 | ||||||
| 2025-11-14 | 13F | Millennium Management Llc | Call | 0 | -100,00 | 0 | -100,00 | |||
| 2026-02-13 | 13F | Ashford Capital Management Inc | 10.000 | 239 | ||||||
| 2026-02-17 | 13F | MIRAE ASSET GLOBAL ETFS HOLDINGS Ltd. | 44.250 | 18,67 | 1.057 | -51,51 | ||||
| 2025-09-24 | NP | FHLC - Fidelity MSCI Health Care Index ETF This fund is a listed as child fund of Fmr Llc and if that institution has disclosed ownership in this security, then these positions will not be double counted when calculating total shares and total value | 17.331 | 241 | ||||||
| 2025-09-26 | NP | BIPIX - Biotechnology Ultrasector Profund Investor Class | 8.698 | -10,01 | 121 | -14,79 | ||||
| 2026-02-17 | 13F | Artia Global Partners LP | 1.023.539 | 55,35 | 24.493 | -36,31 | ||||
| 2026-02-13 | 13F | FORA Capital, LLC | 13.313 | 319 | ||||||
| 2026-02-06 | 13F | EverSource Wealth Advisors, LLC | 109 | 0,00 | 3 | -66,67 | ||||
| 2026-02-06 | 13F | Diamond Hill Capital Management Inc | 33.333 | 0,00 | 798 | -59,02 | ||||
| 2026-02-13 | 13F | Morgan Stanley | 716.927 | 122,99 | 17.156 | -8,58 | ||||
| 2026-02-17 | 13F | Raymond James Financial Inc | 0 | -100,00 | 0 | |||||
| 2026-02-13 | 13F | Headlands Technologies LLC | 39.616 | -30,99 | 948 | -71,70 | ||||
| 2025-09-26 | NP | FZROX - Fidelity ZERO Total Market Index Fund This fund is a listed as child fund of Fmr Llc and if that institution has disclosed ownership in this security, then these positions will not be double counted when calculating total shares and total value | 22.801 | 1,26 | 317 | -4,52 | ||||
| 2026-02-17 | 13F | Persistent Asset Partners Ltd | 11.014 | 264 | ||||||
| 2026-02-17 | 13F | Perceptive Advisors Llc | 0 | -100,00 | 0 | |||||
| 2026-02-17 | 13F | Bank Of America Corp /de/ | 329.525 | 11,65 | 7.886 | -54,23 | ||||
| 2026-02-17 | 13F | Cape Investment Advisory, Inc. | 40 | 1 | ||||||
| 2026-02-13 | 13F/A | Virtus ETF Advisers LLC | 0 | -100,00 | 0 | |||||
| 2025-09-29 | NP | PRFZ - Invesco FTSE RAFI US 1500 Small-Mid ETF This fund is a listed as child fund of Invesco Ltd. and if that institution has disclosed ownership in this security, then these positions will not be double counted when calculating total shares and total value | 49.146 | -33,87 | 684 | -37,59 | ||||
| 2026-02-13 | 13F | Diametric Capital, LP | 11.822 | 119,62 | 283 | -10,19 | ||||
| 2026-02-13 | 13F | Voss Capital, LLC | 210.000 | 68,00 | 5.025 | -31,13 | ||||
| 2026-01-15 | 13F/A | Persistent Asset Partners Ltd | Call | 0 | -100,00 | 0 | -100,00 | |||
| 2026-02-17 | 13F | Price T Rowe Associates Inc /md/ | 208.646 | -77,15 | 5 | -92,45 | ||||
| 2026-02-13 | 13F | Manufacturers Life Insurance Company, The | 0 | -100,00 | 0 | |||||
| 2025-11-14 | 13F | Wolverine Trading, Llc | 20.098 | 45,73 | 1.194 | 524,61 | ||||
| 2025-11-14 | 13F | Wolverine Trading, Llc | Call | 111.100 | 105,36 | 6.599 | 781,04 | |||
| 2025-11-14 | 13F | Wolverine Trading, Llc | Put | 92.300 | 368,53 | 5.483 | 1.908,06 | |||
| 2025-09-24 | NP | CSMIX - Columbia Small Cap Value Fund I Class A | 391.190 | 2,11 | 5.445 | -3,70 | ||||
| 2026-02-17 | 13F | Gilder Gagnon Howe & Co Llc | 0 | -100,00 | 0 | |||||
| 2026-02-17 | 13F | Balyasny Asset Management Llc | 135.644 | -59,29 | 3.246 | -83,32 | ||||
| 2026-02-13 | 13F | Atika Capital Management LLC | 0 | -100,00 | 0 | |||||
| 2026-02-13 | 13F | Rhenman & Partners Asset Management AB | 79.375 | 1.899 | ||||||
| 2026-01-16 | 13F | Tema Etfs Llc | 0 | -100,00 | 0 | -100,00 | ||||
| 2026-02-10 | 13F | Goldman Sachs Group Inc | 1.167.608 | 76,32 | 27.941 | -27,72 | ||||
| 2026-02-12 | 13F | Brinker Capital Investments, LLC | 10.768 | 258 | ||||||
| 2026-02-17 | 13F | Burkehill Global Management, LP | 0 | -100,00 | 0 | |||||
| 2025-11-13 | 13F/A | Peak6 Llc | 0 | -100,00 | 0 | -100,00 | ||||
| 2026-02-12 | 13F | Financial Engines Advisors L.L.C. | 0 | -100,00 | 0 | |||||
| 2026-02-09 | 13F | Geode Capital Management, Llc | 776.071 | 7,54 | 18.578 | -55,91 | ||||
| 2026-02-06 | 13F | IFP Advisors, Inc | 1.989 | 48 | -18,97 | |||||
| 2026-02-17 | 13F | Whitefort Capital Management, LP | 459.000 | 10.984 | ||||||
| 2026-02-17 | 13F | Advisor Group Holdings, Inc. | Call | 1 | 1 | |||||
| 2026-02-13 | 13F | Mml Investors Services, Llc | 33.937 | 812 | ||||||
| 2026-02-17 | 13F | Coppell Advisory Solutions LLC | 0 | -100,00 | 0 | |||||
| 2026-02-11 | 13F | Franklin Resources Inc | 746.602 | -62,46 | 17.866 | -84,61 | ||||
| 2026-01-16 | 13F | Standard Life Aberdeen plc | 3.678.640 | 25,13 | 88.030 | -48,70 | ||||
| 2026-02-17 | 13F | PFM Health Sciences, LP | 39.499 | -14,79 | 945 | -65,06 | ||||
| 2026-02-13 | 13F | Vontobel Holding Ltd. | 11.933 | 286 | ||||||
| 2026-02-13 | 13F | Motiv8 Investments LLC | 45 | 0 | ||||||
| 2026-02-03 | 13F | Ballentine Partners, LLC | 0 | -100,00 | 0 | |||||
| 2026-01-29 | 13F | Nbc Securities, Inc. | 2 | 0 | ||||||
| 2026-02-02 | 13F | Montag A & Associates Inc | 5 | 0 | ||||||
| 2025-09-26 | NP | PTH - Invesco DWA Healthcare Momentum ETF This fund is a listed as child fund of Invesco Ltd. and if that institution has disclosed ownership in this security, then these positions will not be double counted when calculating total shares and total value | 104.316 | -45,23 | 1.452 | -48,33 | ||||
| 2026-02-17 | 13F | Persistent Asset Partners Ltd | Put | 688 | 0,00 | 180 | 22,45 | |||
| 2026-02-12 | 13F | Steward Partners Investment Advisory, Llc | 250 | 0,00 | 6 | -64,29 | ||||
| 2026-02-17 | 13F | Algert Global Llc | 72.150 | 216,31 | 2 | 0,00 | ||||
| 2026-02-13 | 13F | Birchview Capital, LP | 30.789 | -60,89 | 737 | -83,98 | ||||
| 2026-02-13 | 13F | Hudson Bay Capital Management LP | 125.500 | 2.806,44 | 3.003 | 1.091,67 | ||||
| 2026-01-26 | 13F | Mirae Asset Global Investments Co., Ltd. | 3.027 | 42,72 | 72 | -41,46 | ||||
| 2025-11-14 | 13F | EcoR1 Capital, LLC | Call | 0 | -100,00 | 0 | -100,00 | |||
| 2026-02-09 | 13F | Jefferies Financial Group Inc. | 90.542 | 0,00 | 2.167 | -59,01 | ||||
| 2026-02-17 | 13F | Avoro Capital Advisors LLC | 6.150.000 | 38,38 | 147.170 | -43,27 | ||||
| 2026-02-12 | 13F | Quadrant Capital Group Llc | 187 | 0,00 | 4 | -60,00 | ||||
| 2026-02-13 | 13F | Eventide Asset Management, Llc | 498.212 | 11.922 | ||||||
| 2026-02-17 | 13F | Freestone Grove Partners LP | 12.984 | 311 | ||||||
| 2026-02-17 | 13F | Boxer Capital Management, LLC | 290.000 | -63,75 | 6.940 | -85,14 | ||||
| 2026-02-17 | 13F | Point72 Asset Management, L.P. | 24.439 | -90,38 | 585 | -96,06 | ||||
| 2026-02-12 | 13F | Rosalind Advisors, Inc. | 0 | -100,00 | 0 | -100,00 | ||||
| 2026-02-12 | 13F | Commonwealth Equity Services, Llc | 0 | -100,00 | 0 | |||||
| 2026-02-17 | 13F | Ameriprise Financial Inc | 70.796 | -55,46 | 1.694 | -81,74 | ||||
| 2025-10-15 | 13F | Future Financial Wealth Managment LLC | 0 | -100,00 | 0 | -100,00 | ||||
| 2026-02-12 | 13F | Rosalind Advisors, Inc. | Call | 100.000 | 95 | |||||
| 2026-02-13 | 13F | Centiva Capital, LP | Put | 0 | -100,00 | 0 | -100,00 | |||
| 2025-09-25 | NP | ISCB - iShares Morningstar Small-Cap ETF | 2.094 | 29 | ||||||
| 2026-02-12 | 13F | Senvest Management, LLC | 50.000 | 1.196 | ||||||
| 2026-02-17 | 13F | Capital Fund Management S.a. | 82.978 | 1.986 | ||||||
| 2026-01-30 | 13F | Jennison Associates Llc | 1.371.190 | 37,19 | 32.813 | -43,76 | ||||
| 2026-02-11 | 13F | Winton Capital Group Ltd | 48.185 | 17,59 | 1.153 | -51,78 | ||||
| 2026-02-11 | 13F | Deutsche Bank Ag\ | 4.621 | 98,33 | 111 | -19,12 | ||||
| 2026-02-13 | 13F | State Street Corp | 3.231.043 | 123,75 | 77.319 | -8,27 | ||||
| 2026-02-17 | 13F | Farallon Capital Management Llc | 14.000 | -97,52 | 335 | -98,98 | ||||
| 2026-02-17 | 13F | Superstring Capital Management Lp | 0 | -100,00 | 0 | |||||
| 2026-01-08 | 13F | Versant Capital Management, Inc | 85 | -48,48 | 2 | -77,78 | ||||
| 2026-02-10 | 13F | Envestnet Asset Management Inc | 99.593 | 762,35 | 2.383 | 253,56 | ||||
| 2026-02-17 | 13F | Suvretta Capital Management, Llc | 1.216.734 | 29.116 | ||||||
| 2026-02-13 | 13F | Charles Schwab Investment Management Inc | 362.878 | 1,45 | 8.684 | -58,41 | ||||
| 2026-02-17 | 13F | Scientech Research LLC | 10.203 | -65,17 | 244 | -85,72 | ||||
| 2025-11-14 | 13F | Diadema Partners Lp | Call | 0 | -100,00 | 0 | -100,00 | |||
| 2026-02-17 | 13F | Eversept Partners, LP | 62.820 | -92,84 | 1.503 | -97,07 | ||||
| 2025-11-14 | 13F | Centiva Capital, LP | 0 | -100,00 | 0 | -100,00 | ||||
| 2026-02-17 | 13F | Rangeley Capital, LLC | 8.500 | 203 | ||||||
| 2026-02-17 | 13F | Diadema Partners Lp | 45.000 | 1.077 | ||||||
| 2025-09-26 | NP | FZIPX - Fidelity ZERO Extended Market Index Fund This fund is a listed as child fund of Fmr Llc and if that institution has disclosed ownership in this security, then these positions will not be double counted when calculating total shares and total value | 15.009 | 0,00 | 209 | -5,88 | ||||
| 2025-09-29 | NP | LABU - Direxion Daily S&P Biotech Bull 3X Shares Direxion Daily S&P Biotech Bull 3X Shares | 77.118 | 3,18 | 1.073 | -2,72 | ||||
| 2026-02-17 | 13F | Diadema Partners Lp | Put | 301.800 | 0,60 | 7.222 | -58,76 | |||
| 2026-02-06 | 13F | Cullen/frost Bankers, Inc. | 34 | 1 | ||||||
| 2026-02-06 | 13F | Eagle Health Investments LP | 205.247 | 4.912 | ||||||
| 2026-01-20 | 13F | Toth Financial Advisory Corp | 100 | -39,39 | 2 | -77,78 | ||||
| 2026-02-17 | 13F | Cinctive Capital Management LP | Call | 35.000 | 838 | |||||
| 2026-02-13 | 13F | DLD Asset Management, LP | Put | 0 | -100,00 | 0 | -100,00 | |||
| 2026-02-05 | 13F | Requisite Capital Management, LLC | 0 | -100,00 | 0 | |||||
| 2026-02-17 | 13F | Lion Point Capital, LP | 14.700 | 352 | ||||||
| 2026-02-17 | 13F | Freshford Capital Management, LLC | 229.613 | 5.495 | ||||||
| 2026-02-17 | 13F | T. Rowe Price Investment Management, Inc. | 0 | -100,00 | 0 | |||||
| 2026-02-09 | 13F | Huntington National Bank | 2 | 0,00 | 0 | |||||
| 2026-02-12 | 13F | Patient Square Capital LP | 0 | -100,00 | 0 | |||||
| 2026-02-12 | 13F | Campbell & CO Investment Adviser LLC | 0 | -100,00 | 0 | |||||
| 2026-02-12 | 13F | CIBC Private Wealth Group, LLC | 850 | 0,00 | 20 | -59,18 | ||||
| 2026-02-17 | 13F | Monimus Capital Management, Lp | 25.878 | 619 | ||||||
| 2026-02-12 | 13F | BRYN MAWR TRUST Co | 0 | -100,00 | 0 | -100,00 | ||||
| 2026-02-17 | 13F | Sig Brokerage, Lp | 0 | -100,00 | 0 | -100,00 | ||||
| 2026-02-10 | 13F | Lido Advisors, LLC | 5.544 | 0,00 | 324 | 0,00 | ||||
| 2025-11-14 | 13F | Cubist Systematic Strategies, LLC | 62.365 | 3.640 | ||||||
| 2026-02-17 | 13F | Shay Capital LLC | 41.073 | 17,36 | 983 | -51,91 | ||||
| 2026-02-10 | 13F | Quantbot Technologies LP | 5.444 | 130 | ||||||
| 2026-02-13 | 13F | Squarepoint Ops LLC | 176.000 | -3,24 | 4.212 | -60,34 | ||||
| 2026-02-12 | 13F | Monashee Investment Management LLC | 0 | -100,00 | 0 | |||||
| 2025-09-26 | NP | Templeton Global Income Fund | Short | -3.441 | -48 | |||||
| 2026-02-17 | 13F | Delaware Management Holdings, Inc. | 258.211 | 6.179 | ||||||
| 2026-02-13 | 13F | Greenline Wealth Management LLC | 52 | 1 | ||||||
| 2026-02-17 | 13F | Ancora Advisors, LLC | 0 | -100,00 | 0 | |||||
| 2025-09-26 | NP | REBYX - U.S. Small Cap Equity Fund Class Y | 16.417 | 0,00 | 229 | -5,79 | ||||
| 2026-01-29 | 13F | Comerica Bank | 637 | 56,51 | 15 | -34,78 | ||||
| 2026-02-17 | 13F | Fred Alger Management, Llc | 344.878 | -73,27 | 8.253 | -89,04 | ||||
| 2026-02-10 | 13F | Daiwa Securities Group Inc. | 158 | 0,00 | 0 | |||||
| 2026-02-17 | 13F | SummitTX Capital, L.P. | 27.708 | 386,28 | 663 | 99,70 | ||||
| 2026-01-26 | 13F | Private Trust Co Na | 0 | -100,00 | 0 | |||||
| 2026-02-05 | 13F | Tejara Capital Ltd | 42.000 | 1.005 | ||||||
| 2025-11-14 | 13F | Skopos Labs, Inc. | 0 | -100,00 | 0 | |||||
| 2026-02-17 | 13F | Tower Research Capital LLC (TRC) | 76 | -92,71 | 2 | -98,33 | ||||
| 2026-02-17 | 13F | Boothbay Fund Management, Llc | Call | 39.300 | -82,06 | 940 | -92,65 | |||
| 2026-02-11 | 13F | Nationale-Nederlanden Powszechne Towarzystwo Emerytalne S.A. | 521.677 | 0,00 | 12.484 | -59,00 | ||||
| 2026-02-17 | 13F | Boothbay Fund Management, Llc | 30.448 | -22,73 | 729 | -68,33 | ||||
| 2026-02-10 | 13F | Td Asset Management Inc | 23.734 | -75,05 | 568 | -89,79 | ||||
| 2025-11-14 | 13F | Point72 Hong Kong Ltd | 0 | -100,00 | 0 | |||||
| 2026-02-13 | 13F | Transamerica Financial Advisors, Inc. | 71 | 2 | ||||||
| 2026-02-12 | 13F | Principal Securities, Inc. | 0 | -100,00 | 0 | |||||
| 2026-02-13 | 13F | Sofinnova Investments, Inc. | Call | 0 | -100,00 | 0 | -100,00 | |||
| 2026-02-13 | 13F/A | Tyro Capital Management LLC | 663.929 | 15.888 | ||||||
| 2026-02-17 | 13F | D. E. Shaw & Co., Inc. | 131.956 | 305,56 | 3.158 | 66,25 | ||||
| 2026-02-17 | 13F | D. E. Shaw & Co., Inc. | Call | 11.200 | -92,07 | 268 | -96,75 | |||
| 2026-02-13 | 13F | Sofinnova Investments, Inc. | Put | 0 | -100,00 | 0 | -100,00 | |||
| 2026-01-28 | 13F | WPG Advisers, LLC | 10 | -94,90 | 0 | -100,00 | ||||
| 2026-02-17 | 13F | Darwin Global Management, Ltd. | 0 | -100,00 | 0 | |||||
| 2026-02-19 | 13F | Invesco Ltd. | 0 | -100,00 | 0 | -100,00 | ||||
| 2026-02-03 | 13F | Privium Fund Management B.V. | 416.270 | 7,84 | 9.961 | -55,79 | ||||
| 2026-01-29 | 13F | UBS Group AG | 491.454 | 139,75 | 11.760 | -1,71 | ||||
| 2026-02-17 | 13F | Parkman Healthcare Partners LLC | 257.382 | -25,47 | 6.159 | -69,45 | ||||
| 2026-02-13 | 13F | Marshall Wace, Llp | 21.159 | 506 | ||||||
| 2026-02-11 | 13F | Fiera Capital Corp | 768.510 | 18.390 | ||||||
| 2026-02-13 | 13F | Caitong International Asset Management Co., Ltd | 0 | -100,00 | 0 | |||||
| 2026-02-17 | 13F | Voleon Capital Management Lp | 20.243 | 484 | ||||||
| 2026-02-17 | 13F | NEOS Investment Management LLC | 0 | -100,00 | 0 | |||||
| 2026-02-12 | 13F | New York State Common Retirement Fund | 147.549 | 3.531 | ||||||
| 2026-02-17 | 13F | Virtus Investment Advisers, Inc. | 13.636 | 91,62 | 326 | -21,45 | ||||
| 2026-02-04 | 13F | NAN FUNG TRINITY (HK) Ltd | 115.494 | 2.764 | ||||||
| 2026-02-13 | 13F | Rafferty Asset Management, LLC | 164.937 | 99,06 | 3.947 | -18,40 | ||||
| 2025-11-14 | 13F | National Bank Of Canada /fi/ | 0 | -100,00 | 0 | -100,00 | ||||
| 2026-02-17 | 13F | State Of Wisconsin Investment Board | 19.390 | 443,44 | 464 | 123,08 | ||||
| 2025-11-12 | 13F/A | Norges Bank | 0 | -100,00 | 0 | |||||
| 2026-02-26 | 13F | Seven Fleet Capital Management LP | 8.742 | 209 | ||||||
| 2026-02-11 | 13F | Group One Trading, L.p. | 0 | -100,00 | 0 | -100,00 | ||||
| 2026-01-09 | 13F | Assenagon Asset Management S.A. | 606.923 | 14.524 | ||||||
| 2026-02-13 | 13F | Sassicaia Capital Advisers Llc | 10.400 | -35,00 | 249 | -73,42 | ||||
| 2026-02-17 | 13F | Citadel Advisors Llc | Call | 812.400 | 200,89 | 19.441 | 23,36 | |||
| 2026-02-17 | 13F | Citadel Advisors Llc | 469.300 | 9,21 | 11.230 | -55,23 | ||||
| 2026-02-06 | 13F | Mraz, Amerine & Associates, Inc. | 8.495 | -8,84 | 203 | -62,62 | ||||
| 2026-02-17 | 13F | Citadel Advisors Llc | Put | 483.200 | -20,00 | 11.563 | -67,20 | |||
| 2026-02-17 | 13F | Royal Bank Of Canada | 85.640 | -59,49 | 2.050 | -83,39 | ||||
| 2026-02-17 | 13F | Graham Capital Management, L.P. | 9.013 | 216 | ||||||
| 2026-01-05 | 13F | GAMMA Investing LLC | 8 | 100,00 | 0 | |||||
| 2026-02-17 | 13F | Creative Planning | 0 | -100,00 | 0 | |||||
| 2026-02-11 | 13F | Simplex Trading, Llc | 110.675 | 62,77 | 2.648 | 88.166,67 | ||||
| 2026-02-13 | 13F | First Turn Management, LLC | 321.655 | 7.697 | ||||||
| 2026-02-11 | 13F | Simplex Trading, Llc | Call | 475.300 | 104,34 | 11.374 | 87.384,62 | |||
| 2026-02-11 | 13F | Simplex Trading, Llc | Put | 295.800 | -23,37 | 7.078 | 32.072,73 | |||
| 2026-02-17 | 13F | Creek Drive Management Group LLC | Call | 300.000 | 780 | |||||
| 2026-02-17 | 13F | Cetera Investment Advisers | 8.366 | 200 | ||||||
| 2026-01-12 | 13F | Salem Investment Counselors Inc | 0 | -100,00 | 0 | -100,00 | ||||
| 2026-01-23 | 13F | Bellevue Asset Management, Llc | 0 | -100,00 | 0 | |||||
| 2026-02-13 | 13F | Siren, L.L.C. | 0 | -100,00 | 0 | |||||
| 2026-02-17 | 13F | Millennium Management Llc | Put | 30.000 | 0,00 | 718 | -59,05 | |||
| 2026-02-17 | 13F | Millennium Management Llc | 803.605 | 319,42 | 19.230 | 71,96 | ||||
| 2026-02-13 | 13F | Deep Track Capital, LP | 0 | -100,00 | 0 | -100,00 | ||||
| 2026-02-17 | 13F | Vestal Point Capital, LP | 0 | -100,00 | 0 | |||||
| 2026-01-30 | 13F | Activest Wealth Management | 5.000 | 0,00 | 120 | -59,11 | ||||
| 2026-01-26 | 13F | Cwm, Llc | 247 | 0,00 | 0 | |||||
| 2026-01-23 | 13F | Farther Finance Advisors, LLC | 114 | 3 | ||||||
| 2026-02-12 | 13F | Voya Investment Management Llc | 28.850 | -71,75 | 690 | -88,42 | ||||
| 2025-09-26 | NP | RTSSX - Tax-Managed U.S. Mid & Small Cap Fund Class S | 42.913 | -39,97 | 597 | -43,41 | ||||
| 2026-01-21 | 13F | Palumbo Wealth Management LLC | 0 | -100,00 | 0 | -100,00 | ||||
| 2026-01-27 | 13F | Zurcher Kantonalbank (Zurich Cantonalbank) | 19.007 | -4,47 | 455 | -60,90 | ||||
| 2026-02-06 | 13F | Entrust Financial Llc | 190 | 5 | ||||||
| 2026-02-13 | 13F | Nantahala Capital Management, LLC | 699.298 | -30,59 | 16.734 | -71,54 | ||||
| 2026-01-08 | 13F | Sanders Morris Harris Llc | 0 | -100,00 | 0 | -100,00 | ||||
| 2026-02-13 | 13F | Barclays Plc | Put | 162.500 | -14,61 | 3.889 | -65,00 | |||
| 2026-02-13 | 13F | Barclays Plc | Call | 287.500 | 208,48 | 6.880 | 26,45 | |||
| 2026-02-13 | 13F | Alyeska Investment Group, L.P. | 151.058 | 277,64 | 3.615 | 54,84 | ||||
| 2026-02-02 | 13F | Total Clarity Wealth Management, Inc. | 0 | -100,00 | 0 | |||||
| 2026-02-13 | 13F | Barclays Plc | 209.790 | 81,54 | 5.020 | -25,57 | ||||
| 2025-10-30 | 13F | Covestor Ltd | 0 | -100,00 | 0 | |||||
| 2026-02-04 | 13F | LRI Investments, LLC | 0 | -100,00 | 0 | |||||
| 2026-02-17 | 13F | Caption Management, LLC | Call | 635.000 | 66,67 | 15.196 | -31,67 | |||
| 2025-09-23 | NP | FBDIX - Franklin Biotechnology Discovery Fund Class A | 568.800 | -18,32 | 7.918 | -22,97 | ||||
| 2026-02-17 | 13F | Caption Management, LLC | 177.277 | -61,32 | 4.242 | -84,14 | ||||
| 2026-02-17 | 13F | Caption Management, LLC | Put | 217.400 | -58,02 | 5.202 | -82,79 | |||
| 2026-02-17 | 13F | 683 Capital Management, LLC | 384.950 | -64,02 | 9.212 | -85,25 | ||||
| 2026-02-17 | 13F | 683 Capital Management, LLC | Call | 750.100 | 17.950 | |||||
| 2026-01-29 | 13F | China Universal Asset Management Co., Ltd. | 10.150 | 5,54 | 243 | -56,86 | ||||
| 2026-02-17 | 13F | Fmr Llc | 6.240.936 | 2,99 | 149.346 | -57,78 | ||||
| 2026-02-17 | 13F | Ra Capital Management, L.p. | 0 | -100,00 | 0 | -100,00 | ||||
| 2026-02-11 | 13F | Gordian Capital Singapore Pte Ltd | 0 | -100,00 | 0 | |||||
| 2026-02-17 | 13F | Boone Capital Management Llc | 0 | -100,00 | 0 | |||||
| 2026-02-14 | 13F | Rockefeller Capital Management L.P. | 247 | -75,30 | 6 | -91,38 | ||||
| 2025-09-26 | NP | ISCV - iShares Morningstar Small-Cap Value ETF | 4.486 | 21,18 | 62 | 195,24 | ||||
| 2026-02-13 | 13F | Affinity Asset Advisors, LLC | Call | 800.000 | 19.144 | |||||
| 2026-02-13 | 13F | Affinity Asset Advisors, LLC | 50.000 | -83,33 | 1.196 | -93,17 | ||||
| 2026-02-10 | 13F | Bnp Paribas Arbitrage, Sa | 221.343 | -42,60 | 5.297 | -76,47 | ||||
| 2026-02-12 | 13F | Swiss National Bank | 79.000 | 3,54 | 1.890 | -57,56 | ||||
| 2026-02-13 | 13F | Verition Fund Management LLC | 0 | -100,00 | 0 | |||||
| 2026-02-19 | 13F | CI Private Wealth, LLC | 0 | -100,00 | 0 | -100,00 | ||||
| 2026-02-12 | 13F | Knott David M Jr | 4.000 | 100,00 | 96 | -18,10 | ||||
| 2026-02-17 | 13F | Nomura Holdings Inc | 15.584 | 373 | ||||||
| 2026-02-17 | 13F | Nomura Holdings Inc | Call | 25.200 | 603 | |||||
| 2026-02-17 | 13F | Nomura Holdings Inc | Put | 47.200 | -52,75 | 1.129 | -80,64 | |||
| 2025-11-14 | 13F | Toronto Dominion Bank | 0 | -100,00 | 0 | |||||
| 2026-02-17 | 13F | Prelude Capital Management, Llc | 15.739 | 29,43 | 377 | -46,97 | ||||
| 2026-02-05 | 13F | DnB Asset Management AS | 27.342 | 131,67 | 654 | -4,94 | ||||
| 2026-02-17 | 13F | EcoR1 Capital, LLC | 0 | -100,00 | 0 | |||||
| 2026-02-17 | 13F | Schonfeld Strategic Advisors LLC | 122.529 | -34,89 | 2.932 | -73,31 | ||||
| 2026-02-06 | 13F | Global Retirement Partners, LLC | 67 | -77,67 | 2 | -94,12 | ||||
| 2026-02-10 | 13F | SCS Capital Management LLC | 0 | -100,00 | 0 | |||||
| 2026-02-17 | 13F | Russell Investments Group, Ltd. | 23.707 | -84,18 | 567 | -93,52 | ||||
| 2026-01-30 | 13F | Sigma Planning Corp | 0 | -100,00 | 0 | |||||
| 2026-01-27 | 13F | Gf Fund Management Co. Ltd. | 1.223 | 3,64 | 29 | -57,35 | ||||
| 2026-02-17 | 13F | MPM Oncology Impact Management LP | 1.381.628 | 33.062 | ||||||
| 2026-01-16 | 13F | FNY Investment Advisers, LLC | 2.080 | 25,76 | 0 | |||||
| 2026-01-16 | 13F | FNY Investment Advisers, LLC | Call | 23 | 0 | |||||
| 2025-09-26 | NP | FLXSX - Fidelity Flex Small Cap Index Fund This fund is a listed as child fund of Fmr Llc and if that institution has disclosed ownership in this security, then these positions will not be double counted when calculating total shares and total value | 10.933 | 152 | ||||||
| 2026-02-17 | 13F | Aquatic Capital Management LLC | 0 | -100,00 | 0 | |||||
| 2026-02-11 | 13F | Westfield Capital Management Co Lp | 0 | -100,00 | 0 | |||||
| 2026-02-17 | 13F | Susquehanna Portfolio Strategies, LLC | 28.708 | -2,84 | 687 | -60,21 | ||||
| 2026-02-17 | 13F | Two Sigma Investments, Lp | 1.451.284 | 61,70 | 34.729 | -33,71 |